Showing posts with label mathed. Show all posts

Monday, 19 May 2014

Reflecting On Evidence For The Benefits Of Active Learning

A paper entitled 'Active Learning Increases Student Performance in Science, Engineering and Mathematics' (by Freeman and 6 co-authors) was recently published and got a fair bit of quasi-popular press exposure as the message seemed to be quite simple: Students learn better when they are not simply an audience during contact time (or in other words: lectures aren't the best). I decided that this was a paper that I really wanted to read so I went through the pain of having to google twice (thus making it 'officially' hard to find) and have just finished reading it.


This is a great paper.

Firstly there is a nice definition of what active learning is:
"Active learning engages students in the process of learning through activities and/or discussion in class, as opposed to passively listening to an expert. It emphasizes higher-order thinking and often involves group work."
The definition given in the paper for a traditional lecture is given as:
"[...] student activity is assumed to be limited to taking notes and/or occasional and unprompted questions of the instructor." 
The definition for active learning is not obtained out of thin air but takes in to account over 300 audience members at departmental seminars on active learning throughout North America.

What I particularly like about the definition is that it specifically makes a point of mentioning the higher-order thinking.

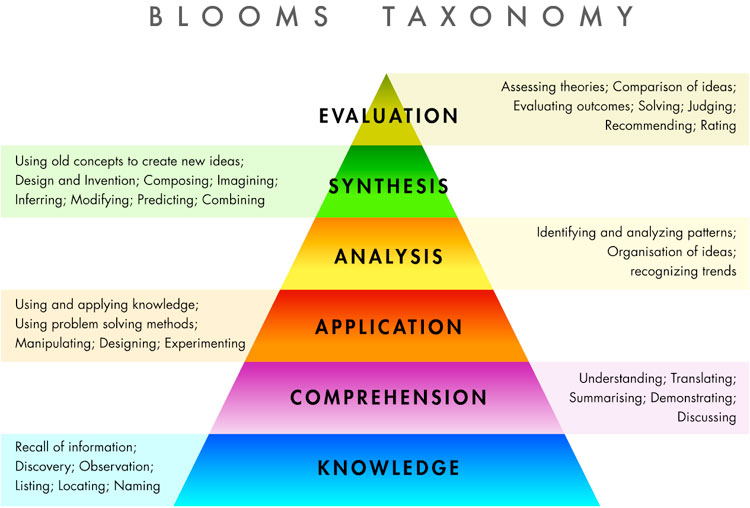
I was recently lucky enough to attend a talk by Dr. Collin Jones who teaches in Tasmania using an active learning approach. Here is a diagram that I've put together trying (humbly) to get across what he said on the subject of active learning (you might want to open the image in a new tab...):


In that I'm trying to say that if we want students to access the higher levels of Bloom's taxonomy across the various topics in a course, with our help through contact time then a more active learning approach seems logical.

It looks like Freeman's paper confirms this.

It tells us lots of great stuff.

The first section quickly summarsies the findings of rigorously (as far as I can tell the rigour in this paper is great) analysing the results of 225 studies that obeyed the following criteria:
  1. Involved a comparison between traditional lecturing and active learning;
  2. Involved a regular class;
  3. Only looked at comparison where the delivery method was the main change;
  4. Involved a STEM subject;
  5. Included an evaluation of academic performance
This later point is what has made this paper really stand up and get noticed. In fact this and 2 other papers (here and here) are the only papers that offer a meta analysis of student performances. This is not a paper reflecting on teaching methodologies but on the actual effects that teaching methodologies have on student learning.

There are a variety of well presented findings and I will try and summarise them very briefly here:
  1. Students will perform by just under half a standard deviation better in an active learning environment;
  2. Students are 1.5 times more likely to fail in a traditional lecture environment;
  3. 1. and 2. are not affected by the particular STEM subject;
  4. The gain in 1. for concept inventory style assessment are lower than for 'instructor-written' type assessment. This is argued (and I think I agree) to be in line with my arrows going through Bloom's taxonomy. In an active learning environment students are more likely to perform well on tasks that require a deeper learning;
  5. The gain in 1. is more prominent in smaller classes. This also makes sense (taking a class with a minimum number of students of 1, it would be idiotic to lecture and similarly for an infinite class perhaps an active learning approach would not be appropriate).
All of the above is just plain cool to have a rigorous basis for. Potential weaknesses of the study are confidently rebutted in the manuscript itself (for example the number of papers showing no improvement whatsoever that would be needed to lower the impact of the work is shown to be high).

Evidence

+Stan Yoshinobu has written a brief post about Freeman's paper at The IBL blog and I really like:
"The perspective I like to take is one that is used in medicine. When new techniques or treatments are shown through evidence to provide better care for patients, then the medical community adopts those new practices."
This is something alluded to by Freeman et al. They talk about their paper (and others) being the 'first generation' of research in to active learning and that now that there is evidence for the benefits perhaps the second generation of research would start looking at best types of active learning for given students etc...

1 last thing.

The final thing I want to talk about is the potential weakness of this research. This is pointed out by the authors:
"The instructors who implemented active learning in these studies did so as volunteers. It is an open question whether student performance would increase as much if all faculty were required to implement active learning approaches."
My personal opinion is that that really hits the issue on the head. Instructors who innovate with their teaching so as to move away from the tried and tested lecture that has been in place for 100s of years are most probably the academics who have the energy and conviction to put a lot of effort in to their teaching.

Often in academia where the pressure to publish and obtain funding are immense it is sad to say that it's very easy to simply reach for the same set of notes that has always passed down and lecture. This leaves students to attempt to reach deeper levels of learning on their own.

It must also be said though, (as alluded to in the paper) active learning means a variety of things. For example I use problem based learning, flipped classrooms and a combination of active game playing (that I would like to think has some element of inquiry based learning) in my own teaching however active learning in Freeman's paper has a breadth of meanings which include the simple use of clickers to get some form of student engagement with the learning. So I don't necessarily think that an active learning approach implies a huge distancing from classic lecturing for all instructors (see the earlier definitions of the active learning and traditional lecture).

As the authors' state it's a case of now identifying the best pedagogic approaches for instructors as well as students: getting that pairing right.

Fun

I really enjoyed something that Dr Sue Rigby said at the opening of the 2014 HEA STEM conference:
"We have to teach in a way that is fun. We get to choose how we teach"
As educators I think it's very important to remember that we do indeed get to choose how we teach and ultimately active learning is often simply far more fun than traditional lectures (I sure had a smile on my face when trying to teaching cooperative game theory by having students play waste paper basketball).

We should always choose a pedagogic approach for a better reason than "that's how it has always been done". Sound research like the one in this paper seems like a good a reason as any.

-----

Edit: On the 7 and 8th of July (2014) +Paul Harper and I are hosting a workshop on active learning techniques. Please take a look :)

Sunday, 9 February 2014

My students and my first PyCon

A couple of months ago an email somehow found it's way in to my inbox mentioning a new user group that was setting up in Cardiff. This was from some guy called Daniele Procida. As a Python coder really enthusiastic to be part of the Open Source Software (OSS) community I thought this would be awesome so I've been along to the monthly meetings where all things Python and Django are discussed.

However many months later I got to attend my first PyCon (in fact a DjangoCon): https://djangoweekend.org/

Here's the programme that I carried around in my back pocket:


Professor Tim Phillips, the head of the School of Mathematics kindly agreed to sponsor 3 tickets for students on my Computing for Mathematics course. I gave 3 tickets to students as a reward for their individual coursework (James wrote about Markov chains and Snakes and Ladders, Alex about Fractals and Matt about prime numbers).

+Jason Young who has been my research undergraduate student for a couple of years now (and is a very able coder) attended and +Izabela Komenda (a post-doc) also presented some of her PhD work.

Here's a picture of my Cardiff students, Daniele and I:


It was great that so many sponsors contributed to the conference (full list here) and also that +Cardiff University supported the event wholeheartedly, Roger Whitaker (the dean of research for the physical sciences) even opened the scientific talks on Friday.

Frankly:

It was the best conference I've ever been to.


The atmosphere cultivated by the OSS community is really amazing. Everyone is really encouraging, understanding and just plain ol' nice.

From the scientific talks on the Friday where usages for Python in Science were discussed to witnessing what a 'code sprint' was on the Sunday: everyone was just exceptionally nice.

I learnt Django over christmas and the help people were willing to give (not once making my mistakes more than they were) was really cool.

For example this morning I sat down with Baptiste, one of the core Django developers and he really kindly answered all the (noobish) questions I had (before leaving today he actually gave me his card and told me to get in touch if I had any further problems with a particular thing).

That is just one example of the awesome atmosphere that was cultivated during the conference. The event brilliantly mixed advanced programming for one of the most popular web frameworks with accessible topics for every attendee. I think that this is something that is kind of inherent to the OSS community, you are encouraged to put yourself out there and potentially make mistakes.

For this reason alone I'm extremely glad that the 3 undergraduates got to attend the event. 

Fear of failure and mistakes is something that sometimes really holds students back. As educators it's very important for us to make sure students learn to embrace mistakes.

During one of the talks on Saturday a particular particularity of Django was being discussed and I thought to myself:

I wonder if my students will be put off by "how much they don't understand" and perhaps this will end up being a negative experience for them...

I could not have been more wrong, their attitudes were perfect. They realised that they were very much at the beginning of the road (some of them had not coded before October) and just took advantage of everything around them.

James gave a talk on the Friday which was great and Matt gave a lightning talk (less than 5mins):


They all spoke to the experts around them constantly and by Sunday were themselves writing Django apps. It was great to have +Robert Dragan of learnium help some of them debug their code on the Sunday.

In fact towards the end of Sunday James even had Daniele (a core Django developer) and Charlie (a super-duper really helpful and nice Django developer/person) helping him work on a site:


I won't write much more about the whole event but I'll just repeat something that Matt said during his lightning talk.

He started by saying that he was a bit dismayed when at the beginning of his degree he was told that he was going to have to learn how to code (my course is brand new), he then talked about how he thought +Sage Mathematical Software System helped him gain a better understanding of the prime number theorem but it was what he said last that was really awesome (a lot of other attendees commented on it):

"Why did I have to wait until coming to University to learn to code?"

(All the talks on Saturday were recorded so I really look forward to sharing his talk, it was very well delivered.)

This whole event was a really great experience for me but more importantly my students.

The conference will be running again next here which is awesome for my future students. Next time Daniele, (who is one of the most impressive human beings I've ever met) will have (at least) me to help organise the it.

I've already signed up for my next PyCon (http://pyconuk.org/) and more importantly I've asked myself:

"Why did I have to wait till now to attend an OSS conference?"

Sunday, 6 October 2013

Bloom's taxonomy drawn in Tikz

I'm in the middle of writing about various pedagogic theories for PCUTL (a higher education certification process) and I needed a picture of Bloom's taxonomy:


I needed to be able to play around with it a bit (so as to add annotations and colours like in the above picture) so I wanted something in Tikz. I found this helpful stack-exchange post for hierarchical pyramids and stole modified the code from there to get Bloom's taxonomy in Tikz. Here's the stripped down version:


The code is here (I modified the following slightly to give the above standalone image using the tikz standalone document class):


\documentclass{article}

\usepackage{tikz}
\usetikzlibrary{intersections}

\title{Bloom's taxonomy}


\begin{document}
\begin{center}

\begin{tikzpicture}
\coordinate (A) at (-6,1) {};
\coordinate (B) at ( 6,1) {};
\coordinate (C) at (0,7.5) {};
\draw[name path=AC] (A) -- (C);
\draw[name path=BC] (B) -- (C);
\foreach \y/\A in {1/Knowledge,2/Comprehension,3/Application,4/Analysis,5/Synthesis,6/Evaluation} {
\path[name path=horiz] (A|-0,\y) -- (B|-0,\y);
\draw[name intersections={of=AC and horiz,by=P},
name intersections={of=BC and horiz,by=Q}] (P) -- (Q)
node[midway,above] {\A};
}
\end{tikzpicture}
\end{center}

\end{document}


I put it up on +writeLaTeX as well: here.


Friday, 20 September 2013

Revisiting examples of computer assisted mathematics


I'm in the middle of a finishing off some last things for a brand new course we're teaching at +Cardiff University starting in October. I plan on using my first lecture to explain to our new students how important computing/programming/coding is for modern mathematicians.

I will certainly be talking about the 4 colour theorem which states that any map can be coloured using 4 colours. I'll probably demo a bit of what +Sage Mathematical Software System can do. Here's a sage cell that will demo some of this (click evaluate and you should see the output, feel free to then play around with the code).


There I've written some very basic code to show a colouring of a graph on 9 vertices.

I expect that Students might find that interesting in particular if I show colourings for non planar graphs. For example here's another cell showing the procedure on complete graph on 9 vertices:


That is just a couple of 'qwerky' things that don't really go near the complexities of the proof of the 4 colour theorem.

I took to social media in the hope of asking for more examples of cool things that mathematicians use computers for. Here's a link to the blog post but without a doubt the most responses I got was on this G+ post.

You can see all the responses on that post but I thought I'd try to compile a list and quick description of some of the suggestions that caught my eye:
  • This wiki was pointed out by +Kevin Clift which contains a large amount of great animations (like the one below) made by 'Keiff':
'This is the curse of computing: giving up understanding for an easy verification.'
  • +Joerg Fliege mentioned chess endgame tablebases which I think would be a cool thing to point out to students.
  • +David Ketcheson+Dima Pasechnik and others pointed out how computer algebra systems are more or less an everyday tool for mathematicians nowadays. When I'm finding my way through a new project I normally always have a sage terminal open to try out various algebraic relationships as I go...
There are a couple of other things that I'm not listing above (mainly because I don't know enough about them to be able to comment), but interestingly enough +Timothy Gowers posted the other day a link to a paper that he has co-authored entitled: 'A fully automatic problem solver with human-style output'. In that paper a new program is described able to produce human style proofs of theorems. A blog post that +Timothy Gowers put up a while back was actually an experiment for this paper.

I'm obviously missing a large amount of other stuff so please do let me know :)

Sunday, 15 September 2013

A playlist of short intro to LaTeX videos using the cloud based writeLaTeX.com

I've just finished screencasting, editing and uploading 21 videos to a playlist on +YouTube.

Quite frankly I'm exhausted (I started this morning), it's been a long day and I'll be happy to not have to drag another 'Ken Burns' effect boundary box around for quite a while...

Anyway, the videos are for a new course I'm teaching our +Cardiff University first year undergraduates. LaTeX has never actually been on the curriculum before and I'm throwing it in at the end of a long term (where students will mostly be learning Python and +Sage Mathematical Software System).

There are a bunch of really really great LaTeX tutorials all over the web but I thought I'd put together really short videos (the longest is around the 4 minute mark but all the others are less than 2 minutes) that just show syntax. By watching these videos no one will be a LaTeX expert (that's where the other tutorials come in).

The other particularity of these videos is that I've done them entirely using +writeLaTeX (https://www.writelatex.com/) which is a great cloud based LaTeX environment. If you don't know about writeLaTeX take a look at this great video by +John Hammersley (1 of the guys behind +writeLaTeX):


The great advantage of writeLaTeX is that I can include 2 links in the description of every video I've put together:

1. A link that creates a blank document so that anyone watching my video can right then and there try out the code.
2. A 'read only' link to the actual document I used during the video. Once this document is being viewed anyone can choose to make a copy of it so that they can play with the actual finished article.

For example: here's the video showing how to include inline mathematics:


1. Here's the link to a blank document.
2. Here's the link to the code created in the video. On the top right of that document you should see this link (which allows you to create your own copy that you can edit):


I'm hoping this will all be quite helpful to my students and in particular encourage the use of LaTeX by removing certain difficulties that some have with the installation process.

I'm also making these videos public in case they might be helpful to others (a large chunk of the videos I've put together for the programming aspects of this course are 'Unlisted' as I don't think they'd interest anyone).

Anyway the whole playlist can be found here.

There are a couple of other cloud based LaTeX environments out there (sorry for mentioning them here +John Hammersley!) including the 1 that is a part of the ridiculously awesome https://cloud.sagemath.com/. At the moment though, the user friendliness and amazing response to users (on G+ +writeLaTeX are extremely helpful) makes this an ideal tool for learning LaTeX.

Saturday, 8 June 2013

Student choices between SAS and R in Individual Coursework

This is the third post is a small series of posts reflecting on my teaching in a new class (all teaching materials can be found here) introducing students to SAS and R on our MSc course. The two previous posts have so far just been a reflection on student's attitudes towards each piece of software.
In the first of those posts I said how I was slightly surprised at how students had chosen to use SAS for 1 particular question where they had the option of the language. In my opinion it was a problem much easier to tackle with R (all the course works, class tests etc can be found on this site). I also mentioned in that post how I asked students which language they preferred. Almost all students answered that it depends on the task (which is a great answer) but after pushing them for a particular decision a strong majority seemed to prefer R. I posted on G+ recently about a particular interaction I've had subsequently with a student which seemed to confirm this attitude of needing to find the correct tool for the correct job.

In the second post I described how students in their group presentations (asking them to teach me something I had not taught them) mostly evaluated SAS v R for certain tasks. It was great to see them identify strengths and weaknesses for each language.

This post is about their choices in their individual coursework.

Similar to their class test (which I discuss in the first post of this series) there was a question which allowed students to choose a language in this individual coursework component of the class (which can be found here).

In my opinion this question made use of quite a big data set (generated by some research I'm currently doing) and I thought it would probably be simpler to approach in SAS. About 52% of the class agreed with me whilst 48% seemed to still prefer R. First of all, I could be wrong and R could indeed be better suited for this question, secondly it might also be a reflection of the personal preferences that the students seemed to indicate when I asked: most students seemed to prefer R. If the latter is the case then I suppose it's nice to see that students not just realise that there's a better tool for a given job but also a better tool for a particular person doing a given job. I'll be keeping a track of this over the years and see how (if) it changes.

In my next post in this series I'll start to reflect on some of the teaching methodologies I used.

Monday, 3 June 2013

An online list of mathematics books

A couple of days ago +James Noble posted a link on G+ to a spreadsheet on G+ that is editable publicly inviting people to contribute mathematics books.


The link to the sheet it here and so far it has 65 books on it (there is also a meta list of lists that has 8 lists of books; to which I've added these 2 previous posts: about mathed and about game theory) and a website I've put together that uses it as an underlying database (which I'll talk about below) can be found here.

I think this is a great idea!

It's completely open and anyone can add to it and also benefit from it. I've used various keywords to search and have found 1 or 2 books that I didn't know about.

Some initial analysis of the list

I decided I'd throw some python at this spreadsheet and first of took a look at the contributors. In particular how many books are individuals contributing (a link to all the python code is available here).


As you can see about 50% of people contribute more than 1 book (including yours truly).

I was also curious as to how many authors were listed:


Here however it seems rare for an author to have more than 1 book in the list. The most prolific author is J. SCOTT CARTER with 5 books.

Some very basic natural language analysis

Two fields in the data set that I have not yet mentioned are the 'Overview' field and the 'Target' field. These two allow for some free text describing what the book is about and who it is aimed at. I used the nltk python library (python really is crazy, anything and everything has a library) to take a look at the frequency of "uncommon" words in these two fields.

First of all the description of the books:


Nothing too surprising here (I should perhaps remove certain words from this frequency analysis) but it's cool to see that "History" is pretty high up, as well as "Teaching" and "Philosophy".

The final piece of analysis is the frequency of the words in the description of who the book is for:


An initial glance at this seems to indicate that the books on the list are mainly aimed at students and or/teachers. It would be nice I suppose to see more books for research...

A very basic static website

The other thing that the code I've put together does is write a website that is hosted using (github pages) and lists the various books (as well as gives up an up to date analysis of what you see above). The website can be found here


The website is very very basic and all static but I've scripted everything (including the download of the spreadsheet although I haven't included that on github yet) so if it's helpful and anyone wants me to update the site just let me know (give me a nudge on G+ and I even check twitter sometimes).

The github repo for all this is here. If you have any ideas for further stuff that could be done to this data set then please improve my analysis or just let me know :) It would be nice to do something slightly smarter with the nltk and also do some analysis of the links between the books (although it would probably need a bunch more books... for that to be insightful)...

A really great job by +James Noble 

I think stuff like this is really great and it's been nice chatting to James about it.


It was cool to watch the list grow (I saw James's post pretty early so go to watch people make a bunch of contributions) and it'd be nice to see it grow even more.


Saturday, 25 May 2013

Student choices between SAS and R in teaching presentations.

This is my second post in a series of posts (the first one is here) about a SAS/R course that I've recently finished teaching to MSc students at +Cardiff University.

I taught this course using a hybrid of flipped classrooms / IBL (although I'm cautious when using the term IBL as I'm not entirely sure my approach fits with any variation of Moore's methods). I gave students access to all the content of the class before hand (including notes, exercises and a series of screencasts - all the materials are here if they're of interest). The students were then given "challenges" and had to deliver their solutions to as presentations to the other students in the class. The aim of this was to get the students to teach themselves/each other and quite often I would not actually have to say much at all during a class (this allowed for a better use of 'me' by the students during the lab sessions).

(Here's a previous post about flipping the classroom and here's one about IBL)

In the previous post I described how students chose to use SAS and/or R in their class test. Most students chose SAS despite displaying a preference for R when asked.

The above is 1 of 3 assessments that the students have had to go through. This post is about the second assessment: a group presentation. In this presentation I asked students to teach an aspect of SAS or R that had not been covered in class (you can see the brief here).

I believe that this is a particularly important thing to assess as I in no way can pretend to teach them everything. It's important that they know how to learn new things that they might need in their career.

I was expecting groups to select a particular language and then a particular topic but interestingly most groups chose to look at both languages and compare strengths and merits.
I had 6 groups and here are the subjects that they looked at:
  • Time series forecasting: both in SAS and R;
  • Principal component analysis: both in SAS and R;
  • Random sampling: both in SAS and R;
  • Survey sampling (in SAS) and the creating a gif of the Mandelbrot set (in R);
  • Scorecard building in SAS;
  • Mapping and spatial analysis: in R.
The 3 groups who carried out a single thing in both SAS and R did a good job of describing strengths and weaknesses of both languages. It was a pleasure to see and again reassures me that an important message has gotten across to the students which is that there is not 1 best tool but an appropriate tool for a particular job.

I'm planning on putting the code/slide up for these talks for them to serve as resources for students doing the course next year but I want to wait till I've marked their final piece of work and asked the students if they mind. In the mean time I'll repost this gif of the Mandelbrot set made by 1 of the groups (I thought this was cool!):


I still want to write generally about the teaching/learning methods in this class and will do that later but if it's of interest my PCUTL portfolio is available here and in there I describe and justify a lot of what I'm doing.

Saturday, 18 May 2013

Student choices between SAS and R

I'm going to be writing a couple of posts looking back at a class I've taught that's just coming to an end (at the time of writing this I've got one more group presentation to see).

The course teaches SAS and R in parallel on our MSc course (if it's of interest all the teaching materials are here).

I'll be blogging about this class as I taught it a bit differently to the usual "Students Listen - Teachers Lecture" style. I'll get back to that more in future posts (although a lot of what I've done is in my PCUTL module 2 portfolio).

The purpose of this post will be to briefly discuss two questions that were on my class test that I feel give some (very shallow) information as to how the students experienced the course. (The class test was made of 4 questions: q1 - a simple task to be performed in both SAS and R, q2 - a task in SAS, q3 - a task in R and finally q4 - a task in either language.)

The class is taught over 5 weeks:
  1. Week 1: Introduction and basic statistics
  2. Week 2: Data manipulation
  3. Week 3: Programming
  4. Week 4: Extras (for example we take a look at proc optmodel and ggplot2).
  5. Week 5: A 2 hour class test
The first question on the class test (you can see it here) asked the students to rank their enjoyment of each week (the purpose of this question was to give them a nice easy starting point). So a ranking of 1 implied a favorite week while a ranking of 5 implied the least favorite.

This plot shows the mean ranking given to each week:


This data and the following discussion should be taken with no implied rigour: I'm not analysing this too closely and also students might just have written down any sequence of rankings without thinking about things too much (this was after all a test).


First of all it does seem that the students enjoyed the class test the least (which I guess is to be expected).

Secondly, it looks like the first week was perhaps less enjoyed in general.

I think this is also to be expected, I taught the class in a way that I don't believe would have been familiar to the students (I tried to encourage them to teach each other and themselves) so perhaps that first week was just a bit too unfamiliar. I'll try and rectify that in future years (if only by pointing students to what students from previous years did).

Now for the second point.


By design I hope that the students learn how to carry out various programming tasks in SAS and R seeing the strengths and weaknesses of each language as they go. The last question of the class test (again here) involved a bit of data manipulation on small data sets and I believe that the main difficulty was that this question did not force a language on the students. In essence choosing the language was the most important point of the question.

My personal approach would have been to use R for this particular question but interestingly most students chose SAS. Some used a combination (often starting in SAS before realising that perhaps R was better suited which led to a bit of a clumsy hybrid). On average SAS was used by 77% of the students for question 4 (some of which managed the task very well!).

During the group presentations I've been asking students afterwards a "this does not count" question (ie making it clear that there's no wrong or right answer to this and that I'm simply interested/curious):
'If you were starting a consultancy company tomorrow but could use only one package: ether SAS or R which would you pick?'
The really pleasing thing is that almost all of the students miss the constraint in my question and immediately reply something like:
"It depends on the kind of consultancy we'll be doing."
I re-iterate the constraint (after telling them that that's the actual right answer :)), I'd say that a majority of students seem to prefer R. Perhaps the biais towards SAS in the class test was due to the conditions (time was short) but overall it's been nice to see that most students realise that it's about finding the right tool for a particular job.

I'm yet to see the individual course work that they'll be handing in this week, which is of a very similar format. I wonder which language they'll have picked for Q4...

EDIT: Here's the next post in this series (looking at choices between SAS and R during teaching presentations).

Wednesday, 10 April 2013

Two thirds of the average game

The two thirds of the average game is a great way of introducing game theory to students.


I've used this game on outreach events with +Paul Harper, at conferences with +Louise Orpin (when describing my outreach activities with other academics) and also in my classroom. I've blogged about the results before:
The definition of the game from the wiki page is given here:
"In game theory, Guess 2/3 of the average is a game where several people guess what 2/3 of the average of their guesses will be, and where the numbers are restricted to the real numbers between 0 and 100, inclusive. The winner is the one closest to the 2/3 average."
I run this game once without any instruction. I just explain the rules and let them fill in the form in front of them (contained in this repo).

I then bring up slides discussing how iterated elimination of weakly dominated strategies leaves the "rational" strategy to be that everyone guesses 0.


After this I invite the participants to have a second guess. In general the results are pretty cool as you see the initial shift towards equilibrium. The fact that the winning guess in the second play of the game is in fact not 0 gives an opportunity to discuss irrational behaviour and also what would happen if we played again (and again...).

I've run this game a couple of times now and here's the graph of the histogram showing the results for all guesses I've recorded.


You certainly see that the guesses move after rationalising the strategies. Funnily enough though no one has guessed 100 during the first guess but a couple of people have in the second guess. I assume this is either some students trying to tell me that I'm boring them, trying to help a colleague win or I'm perhaps not doing a great job of explaining things :)

Here's some graphs from the individual events that I've collected data for:
  • A talk I gave during a high school revision week:

  • An outreach event with the MSI:

  • MSc students from the 2012-2013 cohort:

  • Academics at a talk on outreach at OR54 (the OR society annual conference):

  • The OR society student conference SCOR2012:

  • Academic at a talk on outreach at YOR18 (The OR society conference for early career academics):


Despite the low number of participants in some of the events they all show a a similar expected trend: the second guesses are lower. Surprisingly on one occasion the second winning guess was actually 1! This is a very quick move towards the theoretical equilibrium.

These experiments have been done on a much wider scale and in a much more rigorous way than my humble "bits of fun" for example the coursera game theory MOOC collect a bunch of data on this game and there's also a pretty big experiment mentioned in this talk:


Having said that I can't recall if other experiments look at successive guesses following an explanation of rational behaviour...

Github repo


I've put all the code used to analyse a game on github. It's a simple python file that can be pointed at a directory or a file and will produce the graph (using matplotlib) as well as spit out some other information. The data set for all these events (the first graph on this post) is also on there and if anyone would like to add to it please let me know :)

(There's also the handout that I use to get the student answers in the repo)

(If you found your way here because of interests in game theory this previous post of mine listing free OSS software for game theory might be of interest)

Monday, 8 April 2013

Using sed to make sure hyper links refer to the correct format of file when using pandoc

In a previous post (which is by far the most popular thing on this blog which is mainly due I believe to a kind retweet by +John Cook and SciPyTip) I describe the makefiles I use to write large documents containing Tikz diagrams and +Sage Mathematical Software System plots in multiple formats (pdf, html and docx) using markdown and pandoc.

This is a short follow up post to fix one minor thing. In the previous post if you created hyper links in your markdown file (say pointing to another markdown document, which for my purposes was multiple chapters in some teaching notes) then all the formats (pdf, html and docx) would all point to the same format.

Here's a slight modification of the pandocipy_given_file.py script (from the previous post) which will use sed to replace the .md to the relevant format in all links.

#!/usr/bin/env python
from sys import argv
from os import system

e = argv[1][:-3]
print e

system("sed 's/.md/.html/g' %s > tmp" % (e + ".md"))
system("pandoc -s tmp -N -o " + e + ".html --mathjax")
system("sed 's/.md/.docx/g' %s > tmp" % (e + ".md"))
system("pandoc tmp -o " + e + ".docx")
system("sed 's/.md/.pdf/g' %s > tmp" % (e + ".md"))
system("pandoc tmp -N -o " + e + ".pdf --latex-engine=xelatex")
system("rm tmp")

This script creates a temporary file (tmp- this is actually important to make sure that the makefile doesn't think that you're recurrently changing the md files) that sed makes sure has the correct format for each link and pandoc can use to get the required files. For example the sed 's/.md/.html/g' command will replace all instances of ".md" with ".html". If you're not familiar with sed it's a *nix program that allows you to do find and replace in files "easily" (it's still a bit of voodoo to me). The script can be used by simply typing:

python pandocipy_given_file.py file.md

(Which assumes that file.md has all links sending to other md files.)

I use this script in the makefile as I did in the previous post:

md = $(wildcard *.md)
htmls = $(md:%.md=%.html)

all: $(htmls)

%.html: %.md
    ./pandocipy_given_file.py $<
    ../Scripts/generate_website.py

The final line of that file is not relevant to this blog post but it just runs a python script that will generate the website for the course (which is still a work in progress!). That python script doesn't do anything fancy but it goes in to each Chapter document for example and reads the Chapter title which it uses to write the index.html file. All this allows me to modify a given md file and simply run make to update the website file.

If any of this is of interest the github repo is here.

Note that in this particular case the links being "format loyal" is mainly useful for the `html` files to the general audience. The loyal links in pdf and docx format are mainly useful to me as all the paths are relative to my setup. I'm posting this again so that I don't forget it but also in case it's useful to others (you can obviously use sed to replace other things).

Sunday, 24 March 2013

Open Source and/or Free Game Theory Software

Last week I posted some python code I've been putting together:
  • The github repo is here
  • A website with user guide and some videos is here
The code is currently a collection of 4 tools that can solve 4 type of game theoretical problems:
  • Shap.py which calculate the shapley value in a cooperative game;
  • Gale_Shapley.py an implementation of the extended Gale Shapley algorithm for matching games;
  • lrs_nash.py a (clumsy) python wrapper for the lrs library which can be used to solve normal form games. (If anyone wants to contribute to how I speak to the c library please do! - I sadly know pretty much no c yet...)
  • Abm.py which can be used to carry out agent based models of normal form games (to see emergent behaviour).
Here's a screencast demonstrating that last program:


The point of this blog post is to list some of the other pieces of software available that can be used in Game Theory.

List of game theory tools


  1. The lrs library
What it does: This is a self-contained ANSI C implementation as a callable library of the reverse search algorithm for vertex enumeration/convex hull problems and comes with a choice of three arithmetic packages. Basically it's a really smart package that does a lot of things. One of those things is solving normal form games.

Ease of use: Pretty straight forward on a *nix machine. Download a tar file and make the contents of the unpack directory. To use the package you simply pass it a couple of text files as arguments.
  1. The banach.lse.ac.uk/ website.
What it does: This is actually just an online interface making use of the above mentioned lrs library to solve normal form games.

Ease of use: Very very easy. Just point and click and enter in your normal form game.
As far as I can tell that website was put together by +Rahul Savani who is actually connected to the next item on this list.
  1. The Gambit library
What it does: As a disclaimer I haven't actually used Gambit yet. Here's the blurb from the website: Gambit is a library of game theory software and tools for the construction and analysis of finite extensive and strategic games. Gambit is designed to be portable across platforms, and runs on Linux, Mac OS X, and Windows. Reading through the website it looks like it can be used to solve normal and extensive form games. Development seems fairly active with various suggestions (including an implementation of the lrs library) for contributions. It basically looks like a C++ library with a nice GUI also available.

Ease of use: Can't say :) When I get a moment I'm sure I'll try it out...
  1. My Sage interact for 2 by 2 games
What it does: If you're not familiar with +Sage Mathematical Software System I can't recommend it enough. It's an open source mathematics package (Maple, Mathematica etc). It's a very powerful package with a very active community of developers and users. One of the neat tools is the interact website which lets you put up small bits of code online for anyone to use. This is one of those small bits of code that can be used to solve any 2 by 2 game ("any" is a bit of a lie as someone has pointed out that it crashes for some sets of inputs). It's very basic and solves the game algebraically. I actually put this together as a teaching tool (interacts are great for that) and here's the screencast I shared with my students:


Ease of use: Pretty easy, it's again a simple point and click interface available in a browser but it is very limited: it just solves 2 by 2 games.
  1. William Spaniel's calculator
What it does: I've only played with this for a couple of minutes so I won't comment too much but it looks like a solver implemented in VBA for excel for 2 by 2 games. It also looks at the repeated game aspect a bit looking at whether or not a game is a Prisoners Dilemma and what discount factor would be needed to induce cooperation in an infinitely repeated game context.

Ease of use: On a personal level I don't really like opening up an excel file unless I have to (as it usually starts up the various updates and what not) and this also won't run on linux (unless using wine etc...). Having said that it does do what it says on the tin. The VBA seems to be nicely written so that all the results are just shown immediately without the need to run any macros.
  1. My Sage interact for the Shapley value
What it does: This is another code snippet on the +Sage Mathematical Software System interact site which I wrote to accompany a screencast I did for my students showing how to calculate the Shapley value for a cooperative game (note that there's a small error at 3:51):


Ease of use: This is again pretty easy to use. It's a point and click interface in a web browser where one simply says how many players are in the game as well as the characteristic function.
  1. The Gametheory.net list
A list of (mainly Java) programs. Mostly normal form games (some of which are constrained to zero sum games). I haven't tried many of these but I'll mention this one which is written in javascript and lets you play (and find equilibria) for zero sum games of size up to 5 by 5.
  1. Some github repos
A quick search seems to identify two repos on github that are connected to game theory (I restricted my search to python):
Both these repos seem concerned with normal form games but I have not used them.

Conclusions


There is a fair bit of stuff out there for solving normal form games (and the screenshots of Gambit's GUI seem to show a nice ability to handle extensive form games). For larger scale games it seems that something that makes use of the lrs library is the best bet. There does not seem to be much in the form of agent based models and/or other type of games (such as the Gale Shapley algorithm or code to handle the calculation of the Shapley value in cooperative games apart from my humble contributions). In the gametheory.net list there is broken link to something that supposedly would calculate voting indices.

Everything that is out there is pretty easy to use though and there's a lot of open source stuff that people could contribute to :)

On a personal level I'm hoping to continue to develop my packages and I would really like to implement them in +Sage Mathematical Software System at some point if only to have them available as a great and easy to access teaching tool.

I'm sure I must have missed some so I apologise for that (and would love to know about them).

(Here's another game theory related list: A reading list)

Tuesday, 5 March 2013

Game Theory Reading List

I've just finished putting the finishing touches to a course that I'm teaching with a flipped classroom approach which required me spending a fair amount of time putting together some screencasts and various other resources (the class website can be found here).

That's now done and the course is about to start. I'm more or less immediately starting to work on a course I'm teaching next academic year: a 3rd year undergraduate game theory course. I currently teach some basic game theory on our MSc course which just covers some normal form game stuff. I'm really looking forward to prepping and teaching this course.

I've actually compiled a list of 19 books but some of those I have on my kindle so here's a picture of some of the actual books:


To get started I thought I'd compile a list of books that could be of interest to the students. I have read a lot of these, flicked through some and am more or less aware of the existence of others. I thought I'd categorise some of these and might well at some part start reviewing them (similarly to my previous blog series which was ultimately inspired by +Theron Hitchman's series of posts reviewing differential geometry books). The 3 categories are:

  1. Helpful books to deal with the content of the course;
  2. Interesting books to delve in to further concepts from the course;
  3. Other cool books.
1. Helpful books to deal with the content of the course

The course is an introductory course to game theory looking at concepts such as normal form games, evolutionary game theory and games with incomplete information. Here's the books that I feel could prove helpful to students:

- "An Introduction to Game Theory" by Martin Osborne
- "A primer in Game Theory" by Robert Gibbons
- "Game Theory 101: The basics" by William Spaniel


2. Interesting books to delve in to further concepts from the course

Here are some books that could be of further interest to the student, perhaps considering a certain aspect of the course in detail and/or looking in to other things:

- "Selfish routing and the price of anarchy" by +Tim Roughgarden
- "Algorithmic Game Theory" by Noam Nissan, +Tim Roughgarden, Eva Tardos and Vijay Vazirani
- "Chases and escapes" by Nahin
- "Differential Games" by Isaacs
- "The stable marriage problem: structure and algorithms" by Gusfield and Irving
- "Game Theory Evolving" by Herbert Gintis
- "Games and information: An introduction to Game Theory" by Eric Rasmusen


3. Other cool books

Here are some books that don't necessarily fit with the course but are worth a read:

- "The complexity of cooperation" by Robert Axelrod
- "Rock paper scissor: game theory in everyday life" by Fisher
- "Game Theory: A non technical introduction" by Morton Davis
- "Theory of Games and Economic Behaviour" by von Neumann and Morgenstern


If there are any books that anyone thinks I have missed off this list please let me know!

Sunday, 10 February 2013

Creating inclusive mathematics notes using pandoc

For my pcutl portfolio we have recently been considering inclusivity and diversity. One particular issue that has grabbed my attention is distribution of teaching materials. In particular some students (some with Dyslexia for example) find reading plan black on white pdfs difficult. As such they'd rather have notes in a format that they might be able to modify.

As a math teacher there's not much we can do about distributing pdfs made with LaTeX apart from making the LaTeX code itself available.

I looked around a bit and discovered pandoc which is awesome. It allows you to create multiple formats of any particular file. I discussed this with my pcutl group at some point and here's a pic of the main idea we put together:


This works pretty well and I've been using it for a while. In particular it's great for mathematics as pandocs "flavour" of markdown allows for LaTeX.

It started taking me a while to "bash" my way through "pandocing" all my files in any given folder so I wrote a python script that will take all markdown files in a particular directory and spit out html, pdf and docx versions of the file.

Here's a video demoing the script:


The github directory can be found here: https://github.com/drvinceknight/pandocipy

If anyone has any other neat things like pandoc I'd love to hear about them...