Showing posts with label Teaching. Show all posts

Monday, 3 February 2014

An attempt at Golden Balls in class

Today I introduced my students to the concepts of Dominance and Best responses in my new game theory class (Chapters 3 and 4 of my class notes).

To re-affirm ideas we saw previously (normal form representation of games) and also talk about Dominance I tried to set up a kind of Golden Balls game.

Golden Balls is a game show that aired in the UK a while ago and I've never actually seen an episode but the premise is that two players cooperate during the game to come up with a total sum of money that must then be 'shared' using a Prisoner's Dilemma.

If you haven't seen this video before, it's a great example of the end game of the show:


I always show this video to students when talking about Game Theory as I reckon it's pretty awesome.

Here's what I did in class:

I got two students to play the game: A and S. They were to compete against me (as the row player, I was the column player) in the following 5 normal form games (their utility corresponded to the number of chocolates I would owe them):

1. Just a plain old matching pennies game (we played this in class last week and I blogged about it here):

$$\begin{pmatrix}
(1,-1)&(-1,1)\\
(-1,1)&(1,1)
\end{pmatrix}$$

2. A modification of this game with a weakly dominated strategy:

$$\begin{pmatrix}
(1,-1)&(-1,1)\\
(1,-1)&(1,-1)
\end{pmatrix}$$

A and S were both quick to realise  that they should play the second row strategy.

3. A modification of the matching pennies game:

$$\begin{pmatrix}
(2,-2)&(-1,1)\\
(-1,1)&(2,-2)
\end{pmatrix}$$

4. A game with a strategy at which they would definitely win something:

$$\begin{pmatrix}
(2,-2)&(1,-1)\\
(-1,1)&(2,-2)
\end{pmatrix}$$


5. The same game as 4, again (when I play this next year I'll change this game slightly).

This ended up with A and S having about 6 chocolates between them. I then split the team up and told them to play:

$$\begin{pmatrix}
(2,2)&(0,3)\\
(3,0)&(1,1)
\end{pmatrix}$$

If they cooperated (choosing the first strategy) I would double the 6 chocolates and they would have 12 chocolates each. If 1 defected, the defector would have 18 chocolates and the other none. If they both defected they would just have 6 chocolates each.

I asked if they'd like to talk to each other. S, tried but A confidently said: 'no need, I know what you are going to do'. S cooperated and A defected.

There were 1 or 2 'oooos' that were swiftly ended when A proceeded to immediately share his chocolates with A. I in fact ended up just giving the whole box of chocolates I bought:


After this we moved on to talk about best response strategies. 

I asked for a volunteer to player tic-tac-doe with me and we used this as a discussion about best responses:

'Right, now that she has played there, where should I play?'

I put up a picture of +Randall Munroe's tic-tac-toe solution.

All in all it was good fun I think and hopefully helped make the class a bit more 'alive'. I have a (what I think is a) cool idea about a game I'll try and play with my students next week when talking about mixed strategy equilibrium. This could involve a bracket of 16 volunteers...

If you liked the video above, take a look at this one which is pretty awesome too:


Saturday, 16 November 2013

Plotting complex numbers in Sage

I had a student email me overnight asking how to plot complex numbers in +Sage Mathematical Software System.

I spent a couple of minutes googleing and found various command that would plot complex functions:

f = sqrt(x) + 1 / x complex_plot(sqrt, (-5,5), (-5, 5))

This gives the following plot:


This was however not what my student was asking. They wanted to know how to plot a given set of points in the complex plain (referred to as the Argand plane). A quick google to check if there was anything in Sage pre built for this brought me to this published sheet by +Jason Grout.

I tweaked it slightly so that it was in line with the commands my students have learnt so far and also to include axes legends and put the following in to a function:

def complex_point_plot(pts): 
    """ 
    A function that returns a plot of a list of complex points. 
    Arguments: pts (a list of complex numbers) 
    Outputs: A list plot of the imaginary numbers 
    """ 
    return list_plot([(real(i), imag(i)) for i in pts], axes_labels = ['Re($z$)', 'Im($z$)'], size=30)

This function simply returns a plot as required. Here is a small test with the output:

complex_point_plot([3*I, e^(I*pi), e^(I*3*pi/4), 4-4*I])


Here is some code that will plot the unit circle using the $z=e^{i\theta}$ notation for complex numbers (and the Sage srange command):

pts = [e^(I*(theta)) for theta in srange(0, 2*pi, .1)] 
complex_point_plot(pts) 


Here is the output:


I published all this in a worksheet on our server so it's now immediately available to all our students. I'm really enjoying teaching +Sage Mathematical Software System to our students.

A Sage cell with the above code (that you can run in your browser) can be found here: http://goo.gl/jipzxV

EDIT: Since posting this +Punarbasu Purkayastha pointed out on G+ that list_plot can handle complex points right out of the box :) So the above can just be obtained by typing:

pts = [e^(I*(theta)) for theta in srange(0, 2*pi, .1)] 
list_plot(pts, axes_labels=['Re($z$)','Im($z$)'], size=30)

Learn something new everyday...

Sunday, 6 October 2013

Bloom's taxonomy drawn in Tikz

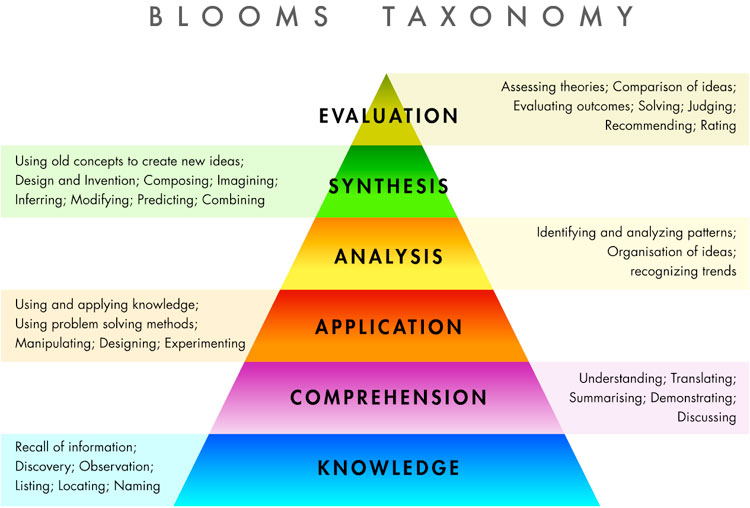
I'm in the middle of writing about various pedagogic theories for PCUTL (a higher education certification process) and I needed a picture of Bloom's taxonomy:


I needed to be able to play around with it a bit (so as to add annotations and colours like in the above picture) so I wanted something in Tikz. I found this helpful stack-exchange post for hierarchical pyramids and stole modified the code from there to get Bloom's taxonomy in Tikz. Here's the stripped down version:


The code is here (I modified the following slightly to give the above standalone image using the tikz standalone document class):


\documentclass{article}

\usepackage{tikz}
\usetikzlibrary{intersections}

\title{Bloom's taxonomy}


\begin{document}
\begin{center}

\begin{tikzpicture}
\coordinate (A) at (-6,1) {};
\coordinate (B) at ( 6,1) {};
\coordinate (C) at (0,7.5) {};
\draw[name path=AC] (A) -- (C);
\draw[name path=BC] (B) -- (C);
\foreach \y/\A in {1/Knowledge,2/Comprehension,3/Application,4/Analysis,5/Synthesis,6/Evaluation} {
\path[name path=horiz] (A|-0,\y) -- (B|-0,\y);
\draw[name intersections={of=AC and horiz,by=P},
name intersections={of=BC and horiz,by=Q}] (P) -- (Q)
node[midway,above] {\A};
}
\end{tikzpicture}
\end{center}

\end{document}


I put it up on +writeLaTeX as well: here.


Monday, 9 September 2013

Handling data files in a Sage notebook (and some linear regression in Sage)

One of my most viewed videos on +YouTube is the following (briefly demonstrating how to import csv files in to +python):


I'm in the middle of preparing various teaching materials for an upcoming class on coding for mathematicians. I'm teaching this class in a flipped classroom (if you don't know what that is circle +Robert Talbert on G+ who posts a lot of great stuff about it) and as a result I've been screen casting a lot recently. Some of these clips are solely intended for my students (as I don't believe they'd be of interest to anyone else 'to do this exercise try and think about what your base case would be for the recursion to terminate'). I'm just starting to screen cast for the +Sage Mathematical Software System part of the course and needed to put together a little something as to how to import data in to a Sage notebook. As the above video seemed quite helpful to people I thought I'd put together another one that might be helpful.


The data file used can be found here.

Here are the lines of code used in the notebook:

import csv

f = open(DATA + 'reg', 'r')  # Open the data file using the special DATA variable
data = csv.reader(f)
data = [row for row in data]  # Read data using csv library
f.close()

data = [[row[2], row[1]] for row in data[1:]]  # Only use data that is of interest, remove unwanted columns and 1st row

a, b = var('a, b')  # Declare symbolic variables
model(t) = a * t + b  # Define model

fit = find_fit(data, model, solution_dict=True)  # Find fit of model to data

model.subs(fit)  # View the model

p = plot(model.subs(fit), 5, 11, color='red')  # Plot fit
p += list_plot(data)  # Plot data
p

Tuesday, 13 August 2013

Social Constructivism in Big Classes

+Theron Hitchman (who is a great guy to follow on G+ and one of the go to guys as far as I am concerned when it comes to Inquiry Based Learning (IBL)) recently posted on G+ wondering how he was going to manage with a course of his having 68 students enrolled.

I am still understanding IBL but it is one of many teaching methodologies that use a constructivist model (here's a post by +Dana Ernst about an article that claims that these approaches aren't that great). I have spoken about constructivism before when reviewing a great education book. The basic concept of constructivism is that students need/should learn through a personal 'construction of the concepts'. IBL does this by giving students the reigns to the direction and also the discovery of the content of a course (I am sure +Dana Ernst, +Theron Hitchman  and others could either forgive me or correct my brief summary).

This is often done (although not exclusively, take a look at +Bret Benesh's post) done through the use of student presentations and generally needs a non-lecture based approach: which is difficult with a large number of students!.

Theron's post on G+ got a lot of comments with people offering advice and +Bret Benesh wrote a nice blog post suggesting a peer learning approach.

I thought I would throw in my two cents as I have recently designed a new course that made use of peer learning.

The course is a statistical programming course on our MSc programme here at +Cardiff University.

You can see all the resources for the course here.

To deal with large teaching numbers in that class (this was the first year of running and it had 27 students but I certainly believe that my approach is scalable and I designed it thinking that I'd have 40+ students at times). I used a peer learning approach based on flipped classrooms, problems and with a hint of IBL thrown in.
  • First of all it took a lot of preparation. I flipped the class completely putting together a full set of notes as well as a full set of videos (you can see them on the site).
  • I made groups of 3/4 out of all the students.
  • For every topic, I put together a set of problems that all the groups where told they had to complete. I called these 'challenges' (it seemed a bit snappier) and you can see them on the course website.
  • Every class (this course was taught in 8 sessions over a 4 week period) started with the me asking who would like to present a solution to the challenge.
The students were aware that their final mark for the course would take in to account participation in these presentations but I made it clear that the corresponding contribution would be mainly based on the fact that they tried and not necessarily how good a job they did. In essence I did not really care whether or not they managed to do the challenges, I just wanted them to work on it!

By the beginning of the 5th session, students were happy to present and needed no gentle nudging from me. In fact some of the students who presented started off by saying "I didn't manage to do this but this is what I tried". Seeing that students got that it was ok to not succeed at something was really great to see. Whenever that happened the students would start discussing amongst themselves how to do a particular problem: and would teach each other!

Throughout all of this, I would sit at the back of the room and vary rarely say anything at all. At times I would perhaps nudge a bit with a "does anyone know a different way to do that?".

One of my favourite memories of the course was towards the end when at the beginning of one session I did not prompt the students to start the class. All of them were just chatting amongst themselves (not about the course) and I was sat at the back observing. After a while one of the students turned around and looked at me questionably. I just smiled. She got up, told everyone that they should get started and the class started teaching itself. That day I didn't actually say anything.

I think this happened to work well because the challenges were designed in such a way so that students were lead through the curriculum but given the nature of the course I also made sure that they had plenty of resources with which they could practice things further.

I encouraged the students to find other resources then the ones I put together and also encouraged them to share their solutions with each other after each session (I believe they used a dropbox folder but I emphasised that I would stay out of the way).

The whole course culminated with one of the assessments being a presentation where the students (still in their group) had to teach me something that was not in the resources made available to them. I wrote about this here and one of the things a group put together was this cool gif of the Mandlebrot set:


I'm currently going through a teaching certification process and have blogged about it many times. You can see my various portfolios [here](http://www.vincent-knight.com/home/teaching/pcutl) but if I am to take only one sentence from everything I've done so far it would be this pretty cool definition of teaching:

"To create learning opportunities."

I believe that teaching in a constructivist framework does exactly that and I really hope that large classrooms do not dissuade educators from using it :)

Anyway, what I hoped would be a perhaps helpful post for +Theron Hitchman ended up just being another page or two of me rambling on...

Sunday, 16 June 2013

Why and how: open education resources.

This is the fourth post in a series of posts reflecting on the teaching and learning in a recent course I've taught on SAS and R. This post will be quite different in nature to the previous posts which looked at students choices between SAS and/or R in their assessment:
Here I would like to talk about how I deliver teaching materials (notes, exercises, videos etc) to my students.

All of the teaching materials for the course can be found here: drvinceknight.github.io/MAT013/.

How they got there and why I think it's a great place for them to be will be what I hope to discuss...

A Virtual Learning Environment that was not as good as alternatives.

At +Cardiff University we have a VLE provided that is automatically available to all our students that all lecturers are encouraged to use. So when I started teaching I diligently started using the service but it had various aspects that did not fit well with my workflow (having to upload files on every change, clunky interface that actually seemed optimised for IE and various other things). It was also awkward (at the time, I believe that this has been addressed now) for students to use the environment on smart phones etc...

As an alternative, I setup a very simple website using google sites and would use +Dropbox's public links to link pdfs and other resources for my students. An example of such a delivery is these basic Game Theoretical materials. This gave me great control, I no longer had to mess around with uploading versions of files, every change I made was immediately online and also as the site was pretty simple (links and pdfs) it was easily accessible to students on all platforms (I could also include some YouTube videos).

An immediate consequence of this approach is that my materials are all publicly available online.

To anyone, our students or not. The first thing I did was check with +Paul Harper: the director of the MSc course that I was only teaching on at the time that this was ok. We chatted about it a bit and were both happy to carry on. My main train of thought was that there are far better resources already available online so mine might as well be. (I've subsequently checked with our School's director of learning and teaching and there's no internal regulations against it which is nice to know about +Cardiff University)

There is a huge amount of talk about open access in research (I won't go in to that here) but less so to some extent in teaching. I did find this interesting newspaper article that ponders as to "Why don't more academics use open educational resources?". This offers a good general discussion about open education resources.

I would feel very very humbled if anyone chose to actually use my resources. I'm at the early part of my career and am still learning so I don't think that will happen anytime soon but there is another more important benefit to having my teaching stuff online for everyone.

I always post about any new courses I'm working on, on G+ and am grateful to get a fair bit of feedback from other academics around the world. This in itself gives me a certain level of confidence in front of my students who know that what I'm teaching them is verifiable by anyone in the world. I've often changed a couple of things based on feedback by other academics and I think that's brilliant.

To some extent my teaching resources are not just reviewed by a couple of peers in my university but also by anyone online who might be interested in them.

(It would be great if research worked this way too)

Through G+ (I've posted about how awesome a tool G+ is as an academic personal development tool) I learnt about git and github. If you don't know about git watch this video by +Zoë Blade is very helpful:


After a while I jumped in and starting using it. After a little longer while I found out that you can use github to host a website:


Using this I it is really easy to put together a very basic website that has all the teaching materials. The added benefit is that the materials are now all in a github repo which opens them up even more (using dbox, only the pdf files were in general in view) whereas now everything is (md, tex source files etc...) and theoretically if anyone wanted to they could pull etc...

I'm certainly not the first person to put teaching stuff up on github, (watching people like +Dana Ernst, +Theron Hitchman and various others do it is what made me jump in).

The github repo for my R and SAS course can be found here and here are some other teaching things I have up on github (with the corresponding webpage if I've gotten around to setting it up):
To finish off here are the various reasons I have for putting my teaching stuff up on github:
  • Openness:
    • my students know that this is viewable by everyone which hopefully gives the resources a level of confidence;
    • people on G+ and elsewhere are able to point out improvements and fixes (if and when they have time);
  • Access: the sites are really simple (basic html with links) so they can be viewed on more or less anything;
  • Ease of use: I don't have to struggle to use whatever system is being used. If it's an option I kind of refuse to use stuff that makes me less efficient (an example of this is our email system: I use gmail). At the moment the system I like is github + git.
I wrote a blog post (which is the most read thing I've ever written - online or offline - I think) showing how to combine various things like tikz, makefiles, +Sage Mathematical Software System etc to automate the process of creating a course site so I'll put a link to that here.

Saturday, 25 May 2013

Student choices between SAS and R in teaching presentations.

This is my second post in a series of posts (the first one is here) about a SAS/R course that I've recently finished teaching to MSc students at +Cardiff University.

I taught this course using a hybrid of flipped classrooms / IBL (although I'm cautious when using the term IBL as I'm not entirely sure my approach fits with any variation of Moore's methods). I gave students access to all the content of the class before hand (including notes, exercises and a series of screencasts - all the materials are here if they're of interest). The students were then given "challenges" and had to deliver their solutions to as presentations to the other students in the class. The aim of this was to get the students to teach themselves/each other and quite often I would not actually have to say much at all during a class (this allowed for a better use of 'me' by the students during the lab sessions).

(Here's a previous post about flipping the classroom and here's one about IBL)

In the previous post I described how students chose to use SAS and/or R in their class test. Most students chose SAS despite displaying a preference for R when asked.

The above is 1 of 3 assessments that the students have had to go through. This post is about the second assessment: a group presentation. In this presentation I asked students to teach an aspect of SAS or R that had not been covered in class (you can see the brief here).

I believe that this is a particularly important thing to assess as I in no way can pretend to teach them everything. It's important that they know how to learn new things that they might need in their career.

I was expecting groups to select a particular language and then a particular topic but interestingly most groups chose to look at both languages and compare strengths and merits.
I had 6 groups and here are the subjects that they looked at:
  • Time series forecasting: both in SAS and R;
  • Principal component analysis: both in SAS and R;
  • Random sampling: both in SAS and R;
  • Survey sampling (in SAS) and the creating a gif of the Mandelbrot set (in R);
  • Scorecard building in SAS;
  • Mapping and spatial analysis: in R.
The 3 groups who carried out a single thing in both SAS and R did a good job of describing strengths and weaknesses of both languages. It was a pleasure to see and again reassures me that an important message has gotten across to the students which is that there is not 1 best tool but an appropriate tool for a particular job.

I'm planning on putting the code/slide up for these talks for them to serve as resources for students doing the course next year but I want to wait till I've marked their final piece of work and asked the students if they mind. In the mean time I'll repost this gif of the Mandelbrot set made by 1 of the groups (I thought this was cool!):


I still want to write generally about the teaching/learning methods in this class and will do that later but if it's of interest my PCUTL portfolio is available here and in there I describe and justify a lot of what I'm doing.

Saturday, 18 May 2013

Student choices between SAS and R

I'm going to be writing a couple of posts looking back at a class I've taught that's just coming to an end (at the time of writing this I've got one more group presentation to see).

The course teaches SAS and R in parallel on our MSc course (if it's of interest all the teaching materials are here).

I'll be blogging about this class as I taught it a bit differently to the usual "Students Listen - Teachers Lecture" style. I'll get back to that more in future posts (although a lot of what I've done is in my PCUTL module 2 portfolio).

The purpose of this post will be to briefly discuss two questions that were on my class test that I feel give some (very shallow) information as to how the students experienced the course. (The class test was made of 4 questions: q1 - a simple task to be performed in both SAS and R, q2 - a task in SAS, q3 - a task in R and finally q4 - a task in either language.)

The class is taught over 5 weeks:
  1. Week 1: Introduction and basic statistics
  2. Week 2: Data manipulation
  3. Week 3: Programming
  4. Week 4: Extras (for example we take a look at proc optmodel and ggplot2).
  5. Week 5: A 2 hour class test
The first question on the class test (you can see it here) asked the students to rank their enjoyment of each week (the purpose of this question was to give them a nice easy starting point). So a ranking of 1 implied a favorite week while a ranking of 5 implied the least favorite.

This plot shows the mean ranking given to each week:


This data and the following discussion should be taken with no implied rigour: I'm not analysing this too closely and also students might just have written down any sequence of rankings without thinking about things too much (this was after all a test).


First of all it does seem that the students enjoyed the class test the least (which I guess is to be expected).

Secondly, it looks like the first week was perhaps less enjoyed in general.

I think this is also to be expected, I taught the class in a way that I don't believe would have been familiar to the students (I tried to encourage them to teach each other and themselves) so perhaps that first week was just a bit too unfamiliar. I'll try and rectify that in future years (if only by pointing students to what students from previous years did).

Now for the second point.


By design I hope that the students learn how to carry out various programming tasks in SAS and R seeing the strengths and weaknesses of each language as they go. The last question of the class test (again here) involved a bit of data manipulation on small data sets and I believe that the main difficulty was that this question did not force a language on the students. In essence choosing the language was the most important point of the question.

My personal approach would have been to use R for this particular question but interestingly most students chose SAS. Some used a combination (often starting in SAS before realising that perhaps R was better suited which led to a bit of a clumsy hybrid). On average SAS was used by 77% of the students for question 4 (some of which managed the task very well!).

During the group presentations I've been asking students afterwards a "this does not count" question (ie making it clear that there's no wrong or right answer to this and that I'm simply interested/curious):
'If you were starting a consultancy company tomorrow but could use only one package: ether SAS or R which would you pick?'
The really pleasing thing is that almost all of the students miss the constraint in my question and immediately reply something like:
"It depends on the kind of consultancy we'll be doing."
I re-iterate the constraint (after telling them that that's the actual right answer :)), I'd say that a majority of students seem to prefer R. Perhaps the biais towards SAS in the class test was due to the conditions (time was short) but overall it's been nice to see that most students realise that it's about finding the right tool for a particular job.

I'm yet to see the individual course work that they'll be handing in this week, which is of a very similar format. I wonder which language they'll have picked for Q4...

EDIT: Here's the next post in this series (looking at choices between SAS and R during teaching presentations).

Friday, 26 April 2013

Invitation to play a game

So I've blogged about the two thirds of the average game quite a few times now. The latest pos that is kind of a summary of the other posts can be found here.

This post is however a bit different. I'm teaching a new game theory course next year and am busy preparing that. I'm planning on using various interactive games to help with my teaching. As a result I've been figuring out google's app engine so that I can host some of these games online.


The result of this is that I've put together an online open version of the two thirds of the average game that I'd really appreciate you taking the time to play.

The website is: twothirdsoftheaveragegame.appspot.com/ and it will take you 3 minutes to make a guess (you're welcome to guess a bunch of times, only your last guess will count).

Thanks to +Leanne Smith, +Zoe Prytherch, +Izabela Komenda, +Penny Holborn and +Angelico Fetta for testing it for me. Hopefully the bugs are all gone :)

I'll let this run for a week and pick the winner(s) on the 3rd of May at 1200 GMT. That's a week away. I would really aprpeciate you taking the time to play and can't offer much to the winners a part from being named (if you would like me to) in my blog post I write next week :)

So please do take the take to guess, more details about the game itself can be found at the site:


All the code for the site can be found at this github repo.

Wednesday, 10 April 2013

Two thirds of the average game

The two thirds of the average game is a great way of introducing game theory to students.


I've used this game on outreach events with +Paul Harper, at conferences with +Louise Orpin (when describing my outreach activities with other academics) and also in my classroom. I've blogged about the results before:
The definition of the game from the wiki page is given here:
"In game theory, Guess 2/3 of the average is a game where several people guess what 2/3 of the average of their guesses will be, and where the numbers are restricted to the real numbers between 0 and 100, inclusive. The winner is the one closest to the 2/3 average."
I run this game once without any instruction. I just explain the rules and let them fill in the form in front of them (contained in this repo).

I then bring up slides discussing how iterated elimination of weakly dominated strategies leaves the "rational" strategy to be that everyone guesses 0.


After this I invite the participants to have a second guess. In general the results are pretty cool as you see the initial shift towards equilibrium. The fact that the winning guess in the second play of the game is in fact not 0 gives an opportunity to discuss irrational behaviour and also what would happen if we played again (and again...).

I've run this game a couple of times now and here's the graph of the histogram showing the results for all guesses I've recorded.


You certainly see that the guesses move after rationalising the strategies. Funnily enough though no one has guessed 100 during the first guess but a couple of people have in the second guess. I assume this is either some students trying to tell me that I'm boring them, trying to help a colleague win or I'm perhaps not doing a great job of explaining things :)

Here's some graphs from the individual events that I've collected data for:
  • A talk I gave during a high school revision week:

  • An outreach event with the MSI:

  • MSc students from the 2012-2013 cohort:

  • Academics at a talk on outreach at OR54 (the OR society annual conference):

  • The OR society student conference SCOR2012:

  • Academic at a talk on outreach at YOR18 (The OR society conference for early career academics):


Despite the low number of participants in some of the events they all show a a similar expected trend: the second guesses are lower. Surprisingly on one occasion the second winning guess was actually 1! This is a very quick move towards the theoretical equilibrium.

These experiments have been done on a much wider scale and in a much more rigorous way than my humble "bits of fun" for example the coursera game theory MOOC collect a bunch of data on this game and there's also a pretty big experiment mentioned in this talk:


Having said that I can't recall if other experiments look at successive guesses following an explanation of rational behaviour...

Github repo


I've put all the code used to analyse a game on github. It's a simple python file that can be pointed at a directory or a file and will produce the graph (using matplotlib) as well as spit out some other information. The data set for all these events (the first graph on this post) is also on there and if anyone would like to add to it please let me know :)

(There's also the handout that I use to get the student answers in the repo)

(If you found your way here because of interests in game theory this previous post of mine listing free OSS software for game theory might be of interest)

Monday, 8 April 2013

Using sed to make sure hyper links refer to the correct format of file when using pandoc

In a previous post (which is by far the most popular thing on this blog which is mainly due I believe to a kind retweet by +John Cook and SciPyTip) I describe the makefiles I use to write large documents containing Tikz diagrams and +Sage Mathematical Software System plots in multiple formats (pdf, html and docx) using markdown and pandoc.

This is a short follow up post to fix one minor thing. In the previous post if you created hyper links in your markdown file (say pointing to another markdown document, which for my purposes was multiple chapters in some teaching notes) then all the formats (pdf, html and docx) would all point to the same format.

Here's a slight modification of the pandocipy_given_file.py script (from the previous post) which will use sed to replace the .md to the relevant format in all links.

#!/usr/bin/env python
from sys import argv
from os import system

e = argv[1][:-3]
print e

system("sed 's/.md/.html/g' %s > tmp" % (e + ".md"))
system("pandoc -s tmp -N -o " + e + ".html --mathjax")
system("sed 's/.md/.docx/g' %s > tmp" % (e + ".md"))
system("pandoc tmp -o " + e + ".docx")
system("sed 's/.md/.pdf/g' %s > tmp" % (e + ".md"))
system("pandoc tmp -N -o " + e + ".pdf --latex-engine=xelatex")
system("rm tmp")

This script creates a temporary file (tmp- this is actually important to make sure that the makefile doesn't think that you're recurrently changing the md files) that sed makes sure has the correct format for each link and pandoc can use to get the required files. For example the sed 's/.md/.html/g' command will replace all instances of ".md" with ".html". If you're not familiar with sed it's a *nix program that allows you to do find and replace in files "easily" (it's still a bit of voodoo to me). The script can be used by simply typing:

python pandocipy_given_file.py file.md

(Which assumes that file.md has all links sending to other md files.)

I use this script in the makefile as I did in the previous post:

md = $(wildcard *.md)
htmls = $(md:%.md=%.html)

all: $(htmls)

%.html: %.md
    ./pandocipy_given_file.py $<
    ../Scripts/generate_website.py

The final line of that file is not relevant to this blog post but it just runs a python script that will generate the website for the course (which is still a work in progress!). That python script doesn't do anything fancy but it goes in to each Chapter document for example and reads the Chapter title which it uses to write the index.html file. All this allows me to modify a given md file and simply run make to update the website file.

If any of this is of interest the github repo is here.

Note that in this particular case the links being "format loyal" is mainly useful for the `html` files to the general audience. The loyal links in pdf and docx format are mainly useful to me as all the paths are relative to my setup. I'm posting this again so that I don't forget it but also in case it's useful to others (you can obviously use sed to replace other things).

Sunday, 7 April 2013

Makefiles for tikz sagemath and teaching notes written in markdown

So I've posted before on multiple occasions about PCUTL which is a higher education certification process I'm currently undergoing. One of the things I paid particular attention to in my latest portfolio (a copy of which can be found at the previous link) is accessibility of teaching notes.

Generally this implies making sure students have notes in a format that they can easily manipulate (for example change font size and color). This is often implied to mean that notes should be written in .doc format. As a mathematician this isn't really an option as all our teaching material really requires to be written in LaTeX.

I have spent some time being amazed by pandoc which is a really smart piece of software that allows you to take documents in various languages and output to a variety of other languages. Here's a video I made showing how I use like to use pandoc to get notes in html,pdf and .docx format (I wrote a blog post here about it):


My entire SAS/R programming course I'm currently teaching was written this way (you can find the notes etc here).

I've recently started writing a new course: a game theory course.

This course needs a bunch of diagrams and plots (as opposed to the previous that basically had a bunch of screenshots). I wanted to use the same overall system but planned on using tikz for the diagrams (tikz lets you draw nice diagrams using code) and perhaps thought about using sagetex (I use +Sage Mathematical Software System a lot but have never used sagetex which lets you have sage code inside of a LaTeX document) for the plots.
After searching around for a bit I didn't see how I was going to be able to use the awesome pandoc to create teaching notes in multiple formats using the above approach. There was no way for pandoc to take the tikz code and output a separate image file for the html (and whatever it needs for .docx).

This blog post is a summary of my approach.

Which basically uses a couple of things:
  • Some tikz code that creates a standalone pdf image;
  • A script that converts a pdf to a png (so that it can be used in html);
  • A makefile so that I can recompile only the tikz code that needs to be recompiled;
That is how I get my tikz diagrams.

I also have a similar system to create plots from sage and I'll also show the makefile I use to get pandoc to sort out the files I want.

Creating standalone pngs with tikz and makefiles


To create a standalone tikz image you need to use the standalone document class. Once you've done that you can just use normal tikz code:

\documentclass[tikz]{standalone}
\usepackage{tikz,amsmath}
\tikzstyle{end} = [circle, minimum width=3pt, fill, inner sep=0pt, right]
\begin{document}
\begin{tikzpicture}
    \draw (0,0) -- (4,0) node [below] {$u_1$};
    \draw (0,0) -- (0,4) node [left] {$u_2$};
    \draw (3,0) node[end] (A) {} node [above=.3cm,right] {$(3,0)$};
    \draw (0,3) node[end] (B) {} node [above=.3cm,right] {$(0,3)$};
    \draw (1,1) node[end] (C) {} node [below,left] {$(1,1)$};
    \draw (2,2) node[end] (D) {} node [above=.3cm,right] {$(2,2)$};
    \draw (A) -- (D);
    \draw (D) -- (B);
    \draw (B) -- (C);
    \draw (C) -- (A);
    \draw [dashed,thick] (C) -- ++(0,1.5);
    \draw [dashed,thick] (C) -- ++(1.5,0);
    \draw [->] (2,3.5) node[above] {\tiny{Feasible average payoffs}} -- (.75,2);
    \draw [->] (4,1.5) node[above] {\tiny{Individually rational payoffs}} -- (1.5,1.25);
\end{tikzpicture}
\end{document}

The above for example creates the following standalone image (note that if you pdflatex it you obviously get a pdf which would be great if you were just pdflatex'ing a bigger document but I'll get to creating a png next):


I've then written a short python script (I'm sure this could be done as easily in bash but I'm just more comfortable in python) that can act on any given tex file to convert it to png:

#!/usr/bin/env python
from sys import argv
from os import system

system("pdflatex %s" % (argv[1]))
system("convert -density 300 %s.pdf %s.png" % (argv[1][:-4], argv[1][:-4]))

This makes use of convert which is a program that can convert pdf to png (more info here but it's natively on Mac OS and *nix I believe).

I call that python file convert_tex_to_png.py and so I can convert any tex file by doing:

python convert_tex_to_png.py file.tex

I'm going to put all these image files (tex and png) in a folder called images and there's (now that I'm done) about 70 image files in there so every time I change or write a new tex file I don't want to compile all the files and I also don't want to have to waste time compiling the particular file I've written.

So I've used makefiles.

Now I've tried to use makefiles before but in all honesty they confuse the heck out of me. I spent a while going through a bunch of tutorials but most of them look at c code. For those who don't know, a makefile is basically a short program that gives instructions to compile certain files. When written well these are great as by simply typing make you can recompile any file that has been modified (and not necessarily all of them!).

So here's the makefile I've converged to using (after heuristically trying a bunch of stuff from stackoverflow):

tex  = $(wildcard *.tex)
pngs = $(tex:%.tex=%.png)

all: $(pngs)

%.png: %.tex
    ./convert_tex_to_png.py $<;

clean:
    rm *.aux
    rm *.log
    rm *.pdf

I save the above file calling it `makefile` so that it is run by default when calling `make`. This will take all the tex files (that have been modified) and output the corresponding png files as required. Note I can also type make clean to remove all auxiliary files (aux, log and pdf).

I find this really useful as I can modify a bunch of tex files and once I'm ready simply run make to get all the pngs as required.

I'll briefly show the (basically same) code I use to get plots from sage as standalone pictures.

Creating standalone pngs with sage and makefiles


I put all the plots created via sage in a plots directory. Here's an example graph created with sage:


The sage code to do that is here:

f(a,b)=a^3/3+3/4*b^2+(1-a-b)^2/2
p = contour_plot(f,(0,.5),(0,.5),colorbar=True,axes_labels=["$\\alpha$","$\\beta$"],contours=100, cmap='coolwarm',fill=True)
p.axes_labels(['$\\alpha$','$\\beta$'])
p.save("L18-plot01.png")

The makefile (which will keep all png files up to date based on the sage files in the directory):

sage  = $(wildcard *.sage)
pngs = $(sage:%.sage=%.png)

all: $(pngs)

%.png: %.sage
    sage $<;

clean:
    rm *.py

(I can similarly use make clean to remove the .py files that get created when running sage in cli).

The final thing I'll show is how to write a makefile to get pandoc to output the required file formats.

Using a makefile with pandoc


So I write all of my notes in markdown. For various reasons which include:
  • Pandoc likes markdown as input (it can also handle tex and html though);
  • I like markdown;
  • I can incorporate latex in markdown when needed.
  • If a student ever wanted to modify the markdown but didn't know LaTeX they'd have an honest chance of knowing what was going on (if you don't know markdown it really is worth taking a look at this short video)
Thus my makefile must be able to compile all modified markdown files. I use a similar approach to the approach I had for tikz diagrams which is to write a short python script:

#!/usr/bin/env python
from sys import argv
from os import system

e = argv[1][:-3]
print e

system("pandoc -s " + e + ".md -N -o " + e + ".html --mathjax")
system("pandoc " + e + ".md -o " + e + ".docx")
system("pandoc " + e + ".md -N -o " + e + ".pdf --latex-engine=xelatex")

(pandocipy_given_file.py is the name of the above python script).

There are basically three pandoc commands going on there. The first creates the html with the LaTeX math being rendered by mathjax, the second creates the .docx format and the last one creates the pdf (using the xelatex engine).

The final piece of the puzzle is to use the following makefile:

md = $(wildcard *.md)
htmls = $(md:%.md=%.html)

all: $(htmls)

%.html: %.md
    ./pandocipy_given_file.py $<;

The way that makefiles work (I think) is to indicate what files you want as an output (and what those files are dependent on). So for example my previous makefiles wanted to output pngs with tex and sage files as dependencies. Here I use the required output as html and the dependencies are the md files.

Using the above I can change any md file and simple type make to get all the pdf, html and docx files updated.

Summary and a couple of things I don't want to forget


I have 3 directories here. The first: Course_notes contains the md files and corresponding python script and makefile. Course_notes also contains 2 other directories: images and plots which both contain the images and plots as I've described above.

So in the md files I refer to an image as so:

![A pic for C1](images/C01-img03.png)


I'm using pdf as the prescribed format of the notes for the course (students are welcome to use html and docx if they wish but I'm recommending pdf) and in general xelatex will sometime move images around to better format the text.

To make sure things don't get confusing I want to be able to \ref and \label images. The easiest way I've found to do this without messing around with the html (who knows what happens with docx, life is too short to worry about everything) is to use the \text:

In the excellently drawn image shown\text{ in Figure \ref{C01-img03}} we see that...

![A pic for C1\label{C01-img03}](images/C01-img03.png)

Pandoc is clever enough to simply ignore what is in the \text when converting to html and docx so that you get documents in html and docx that won't have a reference to the figure (but in general they won't reorder the images) and the pdf will have the documents referenced as you can see in these screenshots (showing pdf and html):

pdf:

html:


I've mainly posted this to make sure I remember how to do it but it might be helpful for others. I'm sure it could be improved by getting rid of my python scripts and having everything in the makefile. I tried that but had a hard time getting wildcards to work as I did so I didn't try anything more complicated. Finally there are ways to get makefiles to run makefiles in subdirectories so it would be nice I guess to also do that so that a single `make` in the highest directory would sort out everything.

I'll be putting all the teaching notes up on github so will link to that repository when I've done it.

EDIT: Here's the github repo and here's a website with all the content (which will eventually become the class website).

ANOTHER EDIT: Here's a follow up post which uses sed to keep the links in the right format.

Tuesday, 5 March 2013

Game Theory Reading List

I've just finished putting the finishing touches to a course that I'm teaching with a flipped classroom approach which required me spending a fair amount of time putting together some screencasts and various other resources (the class website can be found here).

That's now done and the course is about to start. I'm more or less immediately starting to work on a course I'm teaching next academic year: a 3rd year undergraduate game theory course. I currently teach some basic game theory on our MSc course which just covers some normal form game stuff. I'm really looking forward to prepping and teaching this course.

I've actually compiled a list of 19 books but some of those I have on my kindle so here's a picture of some of the actual books:


To get started I thought I'd compile a list of books that could be of interest to the students. I have read a lot of these, flicked through some and am more or less aware of the existence of others. I thought I'd categorise some of these and might well at some part start reviewing them (similarly to my previous blog series which was ultimately inspired by +Theron Hitchman's series of posts reviewing differential geometry books). The 3 categories are:

  1. Helpful books to deal with the content of the course;
  2. Interesting books to delve in to further concepts from the course;
  3. Other cool books.
1. Helpful books to deal with the content of the course

The course is an introductory course to game theory looking at concepts such as normal form games, evolutionary game theory and games with incomplete information. Here's the books that I feel could prove helpful to students:

- "An Introduction to Game Theory" by Martin Osborne
- "A primer in Game Theory" by Robert Gibbons
- "Game Theory 101: The basics" by William Spaniel


2. Interesting books to delve in to further concepts from the course

Here are some books that could be of further interest to the student, perhaps considering a certain aspect of the course in detail and/or looking in to other things:

- "Selfish routing and the price of anarchy" by +Tim Roughgarden
- "Algorithmic Game Theory" by Noam Nissan, +Tim Roughgarden, Eva Tardos and Vijay Vazirani
- "Chases and escapes" by Nahin
- "Differential Games" by Isaacs
- "The stable marriage problem: structure and algorithms" by Gusfield and Irving
- "Game Theory Evolving" by Herbert Gintis
- "Games and information: An introduction to Game Theory" by Eric Rasmusen


3. Other cool books

Here are some books that don't necessarily fit with the course but are worth a read:

- "The complexity of cooperation" by Robert Axelrod
- "Rock paper scissor: game theory in everyday life" by Fisher
- "Game Theory: A non technical introduction" by Morton Davis
- "Theory of Games and Economic Behaviour" by von Neumann and Morgenstern


If there are any books that anyone thinks I have missed off this list please let me know!